from sklearn.model_selection import validation_curve
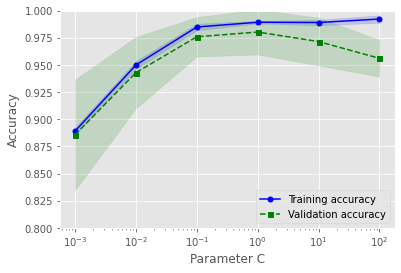
param_range = [0.001, 0.01, 0.1, 1.0, 10.0, 100.0]
train_scores, test_scores = validation_curve(estimator=pipe_lr,
X=X_train,
y=y_train,
param_name='logisticregression__C',
param_range=param_range,
cv=10)
train_mean = np.mean(train_scores, axis=1)
train_std = np.std(train_scores, axis=1)
test_mean = np.mean(test_scores, axis=1)
test_std = np.std(test_scores, axis=1)
plt.plot(param_range, train_mean, color='blue',
marker='o', markersize=5, label='Training accuracy')
plt.fill_between(param_range, train_mean + train_std,
train_mean - train_std, alpha=0.15, color='blue')
plt.plot(param_range, test_mean, color='green',
linestyle='--', marker='s', markersize=5,
label='Validation accuracy')
plt.fill_between(param_range, test_mean + test_std,
test_mean - test_std, alpha=0.15, color='green')
plt.style.use('ggplot')
# fig = plt.figure(figsize=(9.5,6.5))
plt.xscale('log')
plt.legend(loc='lower right')
plt.xlabel('Parameter C')
plt.ylabel('Accuracy')
plt.ylim([0.8, 1.0])
plt.show()